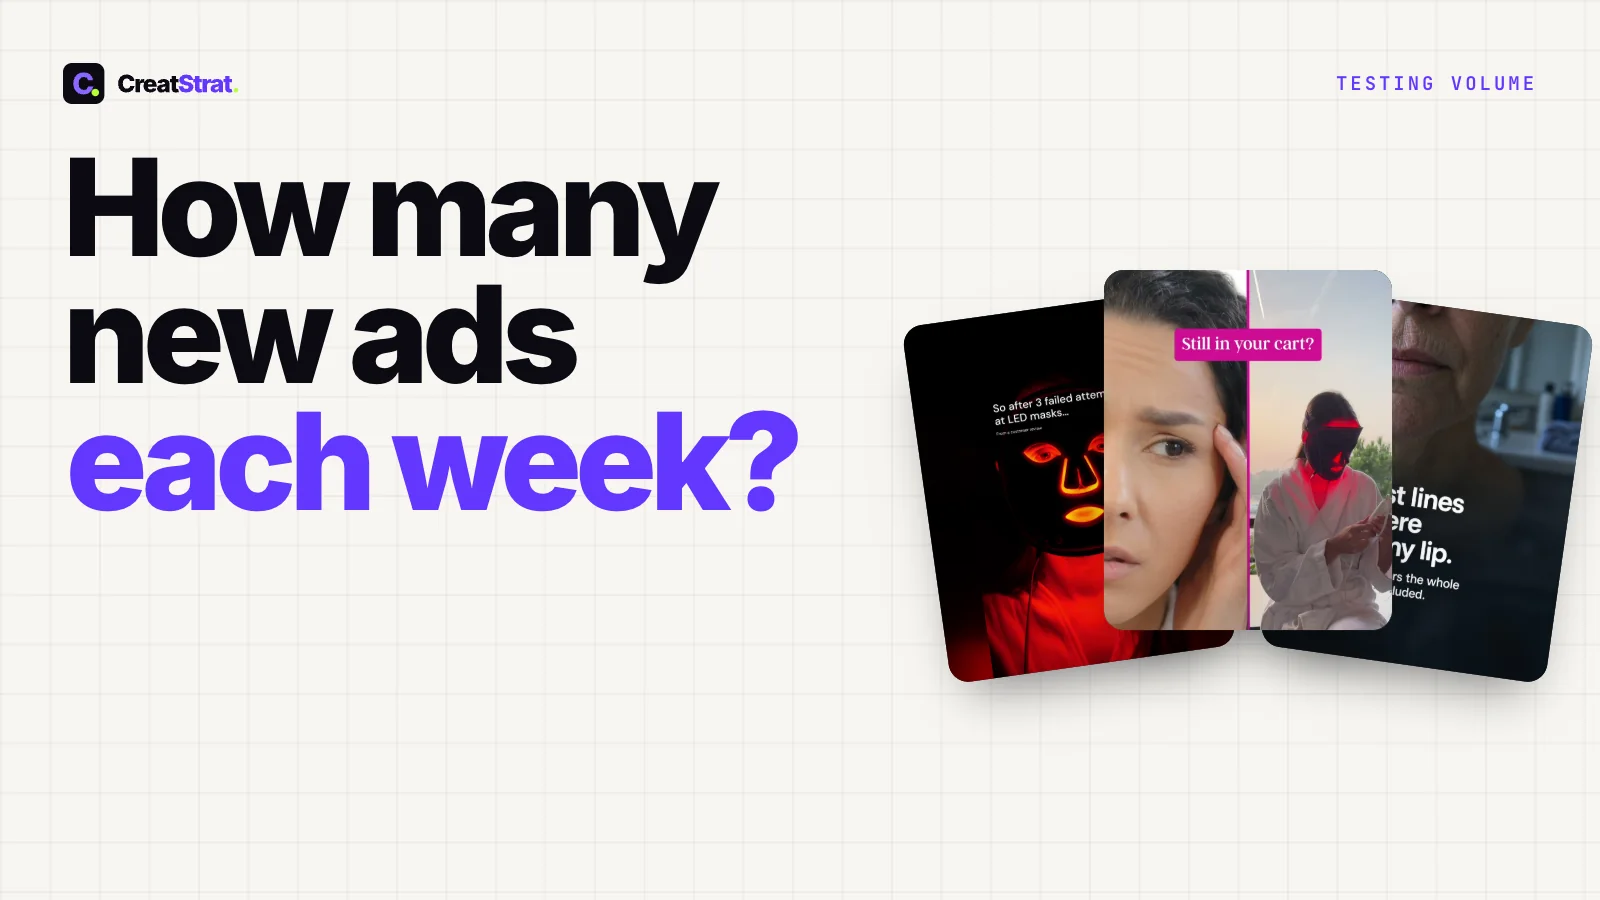
You searched how many new ads per week to launch and came back with three answers: two to three, five to eight, twelve to nineteen or more.
They disagree because they fold two questions into one. How many ads should you launch? And how fast can your budget tell you which of them work? Most published figures answer the second and present it as the first.
Meta answers the first one itself. Its November 2024 guidance for Advantage+ shopping campaigns asks for at least 20 diversified ads, new ads launched every week, and 20-30% of budget set aside for testing. That's a floor and a cadence, and your budget doesn't move either of them.
Keep at least 20 diversified ads live and add at least one new concept every week. Your budget changes how fast you learn which concepts win, not how many you should launch. Meta's 20-ad floor is for Advantage+ shopping campaigns; one new concept a week is our practice.
Why do creative volume benchmarks disagree so much?
Because they answer different questions without saying which. Most "X per week" figures carry no source and no condition, so a number that described one account's testing budget lands on your screen as a launch rule for every account.
Meta's 2024 guidance tells advertisers to keep at least 20 diversified ads in Advantage+ shopping campaigns, launch new ads weekly, and put 20-30% of their ad budget toward testing new ads (Meta for Business, "Three steps to optimize your performance with creative diversification", 19 November 2024).
The page's own wording is "maintaining at least 20 diversified ads in Advantage+ shopping campaigns" and to "routinely launch new ads on a weekly basis." That guidance was written for Advantage+ shopping campaigns; Meta's current product pages describe Advantage+ sales campaigns. We apply the same floor to any campaign where Meta's delivery chooses among your ads. That's our practice, not Meta's wording.
Diversified is the word doing the work. Meta's December 2025 page warns about creative similarity, which happens "when ad images are visually too alike, even if technically different assets." Twenty crops of one photo don't meet the floor in any useful sense (our reading). Creative diversification covers what makes two ads genuinely distinct.
How many new ads should you launch per week, by monthly Meta spend?
The same number at every spend level.
At any monthly spend, the launch answer comes from Meta: at least 20 diversified ads in Advantage+ shopping campaigns and new ads every week. Your spend sets how many purchases the testing budget buys each week, which sets how fast you learn which concepts win (CreatStrat's reading, illustrative arithmetic).
Run it with your own numbers:
- Weekly testing budget: monthly Meta spend × 12 ÷ 52 × your testing share. Meta's range is 20-30%; the example uses 25%.
- Purchases that budget buys: weekly testing budget ÷ your cost per purchase. The example uses $40.
- Where those purchases go: across every concept you're testing, weighted toward the strongest by Meta's delivery (our reading).
| Monthly Meta spend | Weekly testing budget (25% share) | Purchases per week at $40 each |
|---|---|---|
| $10,000 | $577 | 14 |
| $30,000 | $1,731 | 43 |
| $100,000 | $5,769 | 144 |
| $300,000 | $17,308 | 433 |
Those purchases don't divide evenly between your ads. They spread across your concepts, and in our reading Meta's delivery favors the strongest. At $20 per purchase every row doubles; at $80 every row halves (illustrative arithmetic). The table says nothing about how any ad will perform. Results vary.
The table shows how fast your budget reads concepts. The Gap Scan starts on which concepts are worth putting in front of it, beginning with your product page.
Free. 3 researched opportunities, 1 customer-avatar gap, and 1 example concept within 24 hours.
Every row launches the same way: 20 or more distinct ads live and new concepts every week. The $10,000 account waits longer for each concept's read to settle.
A new ad that draws little spend in its first week isn't a wasted test either. It's Meta's delivery choosing among your ads (our reading, informed by the Meta pages quoted below).
Where the numbers you've seen come from, and what Meta's pages say
Meta's Marketing API allows up to 50 non-archived ads in one ad set, and Meta publishes no recommended number below that (Meta for Developers, "Ad Set", Marketing API reference v25.0).
| Claim you've seen | What Meta's pages say | Verdict |
|---|---|---|
| "Meta publishes no creative volume guidance." | At least 20 diversified ads in Advantage+ shopping campaigns, new ads weekly, 20-30% of budget to testing (Meta for Business, 19 Nov 2024) | Half right: no weekly number, but a floor and a cadence |
| "Meta recommends 3 to 5 ads per ad set." | The Marketing API allows up to 50 non-archived ads per ad set and recommends no count (Marketing API reference v25.0) | A convention, not Meta guidance |
| "Every ad needs 50 conversions a week." | Learning happens at the ad set level and stabilizes "with a minimum of 50 events over a 7-day period" (Meta Horizon developer resources, updated 8 Apr 2026) | Misread: the floor belongs to the ad set, not to each ad |
| "Launch a fixed number of new ads per campaign." | Build "a broad portfolio of assets" instead of "producing a fixed volume of ad creatives per campaign" (Meta for Business, 16 Dec 2025) | Meta's later page doesn't repeat a count |
When a number arrives labeled "Meta recommends," look for the dated Meta page behind it. For a weekly creative count, there isn't one. For a floor of diversified ads, there is.
Does your vertical change the number?
Not the launch number. Your vertical changes the speed, through one input you already have: your cost per purchase.
A product with a higher order value often carries a higher cost per purchase. Double it and the same testing budget buys half as many purchases a week, so each concept takes about twice as long to read (illustrative arithmetic). Meta's 20-ad floor for Advantage+ shopping campaigns and our weekly concept cadence both stay put.
We found no published vertical breakdown with a stated method and a primary source, so rerun the table with your own cost per purchase.
What does Meta actually say about creative volume?
In 2024, Meta told advertisers to "launch new ads into your Advantage+ shopping campaigns with regular frequency" and to review the creative brief in a weekly meeting with the ad buyer and creative team (Meta for Business, 19 November 2024).
A year later the emphasis moved from count to range. In December 2025, Meta advised advertisers to build "a broad portfolio of assets" instead of "producing a fixed volume of ad creatives per campaign" (Meta for Business, "Demystifying Creative Diversification", 16 December 2025). That page repeats no count and gives no refresh cadence. We found no Meta page withdrawing the 2024 floor, so we read it as a minimum for variety, not a quota.
It does explain why distinctness matters to delivery. Meta describes Andromeda, its retrieval technology, as the step that "selects a few thousand strong candidates so only the most relevant and distinct creatives move forward". Our reading: near-copies give that step little to choose from.
Meta puts the 50-event learning floor on the ad set, not on each ad: "Learning occurs on the ad set level, and the learning period stabilizes with a minimum of 50 events over a 7-day period" (Meta Horizon developer resources, "Understanding and optimizing your ad campaign", updated 8 April 2026).
Our reading of that sentence: the ads inside an ad set share its events, and Meta's delivery decides which ads get them. When an ad set falls short, Meta's API reports this status (Meta for Developers, "Ad Campaign Learning Stage Info", Marketing API reference v26.0): "The ad set isn't generating enough results to exit the learning phase."
Our practice: consolidate ad sets, not ads. We put new concepts into fewer testing ad sets rather than splitting the budget thin. At a $40 cost per purchase, a testing ad set needs about $2,000 a week to reach 50 events, which a 25% share covers at about $34,700 a month (illustrative arithmetic). Below that, concepts read more slowly; you still launch them.
That learning-phase wording comes from Meta's developer documentation for Horizon (Quest) app advertisers, the only Meta page carrying it that we could verify. The same page advises: "Continuously test various images and videos to identify top performers. Frequent testing will also combat creative fatigue." More in creative fatigue.
What to expect at your spend: how long before a concept read is clear
Spend doesn't spread evenly across a pool. App-install data shows how concentrated it gets.
According to AppsFlyer (29 April 2025), in app-install advertising across about 1,300 apps, the top 2% of creatives drove 43% of non-gaming ad spend.
That's app-install advertising across all networks, not DTC on Meta. It shows the shape of spend concentration, not a rate to expect, and spend share says nothing about profit (creative hit rate covers what each published rate measures). If your account follows the app-install pattern, most new ads will draw little spend and a few most of it. That's the shape a broad pool is supposed to produce.
Calling a winner is a separate question from launching, and it's the one your budget answers. Our practice is to read results at the concept level, with variations of one concept pooled into a single read. Meta's pages don't prescribe that.
How many purchases a concept needs depends on how big a difference you want to see. From a 1% conversion baseline, telling two concepts apart when one converts 50 percent better takes roughly 78 purchases each, and a 20 percent difference takes about 427 (illustrative arithmetic, from how many purchases an ad needs before you call it).
Your weekly purchases from the table set the clock. With four concepts splitting a $30,000 account's 43 weekly testing purchases evenly, each reaches 78 in about seven weeks. At $300,000, the same share of 433 gets there in under a week (illustrative arithmetic, $40 per purchase).
None of that changes how many concepts to launch. It changes how long you wait before you call one. Two habits from the significance post help: "Pre-commit to the signal you will treat as directional" and "Judge concepts across a portfolio over time." Results vary by account, offer, and season.
Can't make new concepts every week? What's the real question?
The arithmetic isn't what stops many teams. Supply is. Twenty distinct ads plus new concepts every week is more research, briefing, and production than many small teams can fit in, so the real question is where a steady supply of distinct concepts comes from.
Our practice is to mix two kinds of ad in every weekly batch: iterations on concepts already drawing spend, and at least one concept the account hasn't run before, so Meta's delivery always has something new to choose.
That's how CreatStrat's weekly plan is built. CreatStrat is a software subscription that delivers finished ads every week. CreatStrat researches, plans the tests, writes the brief, and produces the finished statics, carousels, mashups, AI video, and AI UGC, each with its Meta copy. Your creative strategist is built in. Each week's plan gives every ad one of four jobs: Iterate, Explore, New avatar, or Recombine. Iterate ads build on a concept that already has evidence; Explore and New avatar ads bring new concepts into the pool. CreatStrat learns from your connected Meta results automatically and plans the next batch, so you never send us your results. CreatStrat produces the finished ads; you launch them in your own Meta account.
Strategy + Briefs + Finished Ads is billed monthly and you can cancel anytime. Choose your ad mix to see the price for the formats and weekly count you want. For how the week runs end to end, see the weekly creative operating system.
One customer described what that production capacity looked like for their team:
We increased our creative testing volume from 12 concepts per month to 40 without hiring another strategist or designer.
 Elena R. · CreatStrat customer
That's one customer's account. Results vary, and it isn't a promise or an average.
The number you were looking for
Start with Meta's floor: at least 20 diversified ads in Advantage+ shopping campaigns, new ads every week, and 20-30% of budget to testing (Meta for Business, 19 November 2024). Keep adding new concepts weekly, and check the worked table with your own cost per purchase to see how fast they'll read. Your budget sets that speed, not the launch number.
Planning for Q4? The backwards BFCM calendar works out when each batch needs to exist.
See what that decision looks like for your brand. Share a product page URL and email. Within 24 hours we’ll send 3 researched opportunities, 1 customer-avatar gap, and 1 example concept.
Want to see the app first? Book a demo →
Frequently asked questions
How many new ads should I launch per week on Meta? Meta publishes no weekly number. Its 2024 guidance for Advantage+ shopping campaigns asks for at least 20 diversified ads, new ads weekly, and 20-30% of budget to testing (Meta for Business, 19 November 2024). Our practice adds at least one new concept a week.
How many ads can go in one Meta ad set? Up to 50 non-archived ads (Meta for Developers, "Ad Set", Marketing API reference v25.0). Meta recommends no number below that. "3 to 5 per ad set" is a practitioner convention, not Meta guidance.
How many purchases does a concept need before I call a winner? There's no universal number. From a 1% conversion baseline, about 78 purchases per concept detects a 50 percent difference between two concepts (illustrative arithmetic; Fleiss, Levin and Paik, 2003). We pool variations of one concept into one read (our practice). Smaller differences take far more purchases.
Does Meta's 50-event learning floor apply to each ad? No. Learning occurs at the ad set level, with a minimum of 50 events over 7 days (Meta Horizon developer resources, updated 8 April 2026). In our reading, the ads in one ad set share those events, and Meta's delivery decides which ads get them.
Do variations of one ad count as new ads? Meta separates iteration, same visuals with different text or CTA, from diversification, distinctly different creative (Meta for Business, "Demystifying Creative Diversification", 16 December 2025). We read variations as one concept-level test; Meta doesn't prescribe that. Diversified ads are what keep the pool fresh.
Is it bad to launch more new ads than my budget can test? Meta's guidance doesn't treat it as a problem, favoring "a broad portfolio of assets" over "a fixed volume of ad creatives per campaign" (Meta for Business, 16 December 2025). An ad drawing little spend is delivery choosing among your ads (our reading). Your budget sets how fast concepts read.
Sources
- Meta for Business. "Three steps to optimize your performance with creative diversification." 19 November 2024. https://www.facebook.com/business/news/three-steps-to-optimize-your-performance-with-creative-diversification (accessed 6 October 2026).
- Meta for Business. "Demystifying Creative Diversification." 16 December 2025. https://www.facebook.com/business/news/demystifying-creative-diversification (accessed 6 October 2026).
- Meta. "Understanding and optimizing your ad campaign." Meta Horizon developer resources, updated 8 April 2026. https://developers.meta.com/horizon/resources/optimize-ad-campaign/ (accessed 6 October 2026).
- Meta for Developers. Marketing API reference, "Ad Set" (v25.0). https://developers.facebook.com/docs/marketing-api/reference/ad-campaign (accessed 6 October 2026).
- Meta for Developers. Marketing API reference, "Ad Campaign Learning Stage Info" (v26.0). https://developers.facebook.com/docs/marketing-api/reference/ad-campaign-learning-stage-info/ (accessed 6 October 2026).
- AppsFlyer. "AppsFlyer's 2025 Creative Report Reveals How AI and Emotion Drive Creative Performance." Press release, San Francisco, 29 April 2025. https://www.appsflyer.com/company/newsroom/pr/ai-emotion-creative-trends/ (app-install advertising data; accessed 6 October 2026).
- Fleiss, J. L., Levin, B., & Paik, M. C. 2003. Statistical methods for rates and proportions (3rd ed.). Wiley. ISBN 9780471526292. Chapter 4.
- CreatStrat. "Meta ads statistical significance." https://creatstrat.com/blog/meta-ads-statistical-significance.html (accessed 6 October 2026).